


Every Era Turns. What Happens to a Stock After It Joins the Top 10?
Published Updated

Srikanth Narayan
Founder and CEO

Christopher Lange
Head of Investments
If most of your net worth sits in one of the largest companies in the market, it's easy to stop seeing its place at the top as a ranking. When a company has led the market through years of holding, that position might begin to look untouchable. A century of market history suggests it's worth asking how long it lasts.
We put the research into a short video, the second in our series The Evidence. It runs about five minutes.
What the research found
The research below covers who led, how long companies tend to stay in the index, and what happened to returns once a company reached the top.
Every era has had its own leaders
- In 1900, railroads accounted for 63% of US stock market value. Energy and technology were almost entirely absent from the listed market.¹
- The companies that characterized the market kept changing. General Motors, Standard Oil and Sears around 1950. AT&T and the oil majors by 1970. GE, Walmart and Coca-Cola by 1990. Microsoft, Cisco and Intel at the start of 2000. Mega-cap technology and AI today.²
- Companies are also spending less time in the index. In the late 1970s, the average company in the S&P 500 could expect to stay in the index for 30 to 35 years. This decade, that's forecast to fall to 15 to 20 years.³
What happens to returns after a company reaches the top
Researchers studied every US stock that became one of the 10 largest companies in the country for the first time between 1927 and 2022.⁴
- In the three years before joining the top 10, those companies returned 27.0% a year more than the market, on average.⁴
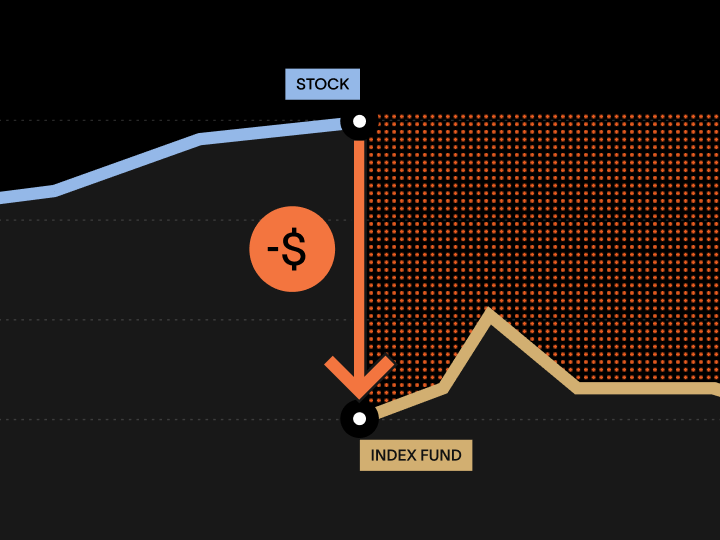
- After joining, that edge faded and then reversed. Relative to the market, they returned +0.6% a year over the next three years, −0.9% a year over five years and −1.5% a year over ten years, on average.⁴
- Intel is the clearest single case. Before it entered the top 10, it was ahead of the market by about 29% a year. For the decade after, it was behind by about 6% a year, a swing of roughly 35 percentage points in annualized excess returns.⁵
- Some companies do hold their position. Microsoft was the largest US-listed company on January 1, 2000, and it's still in the top 10 today.⁶
A reminder from Episode 1
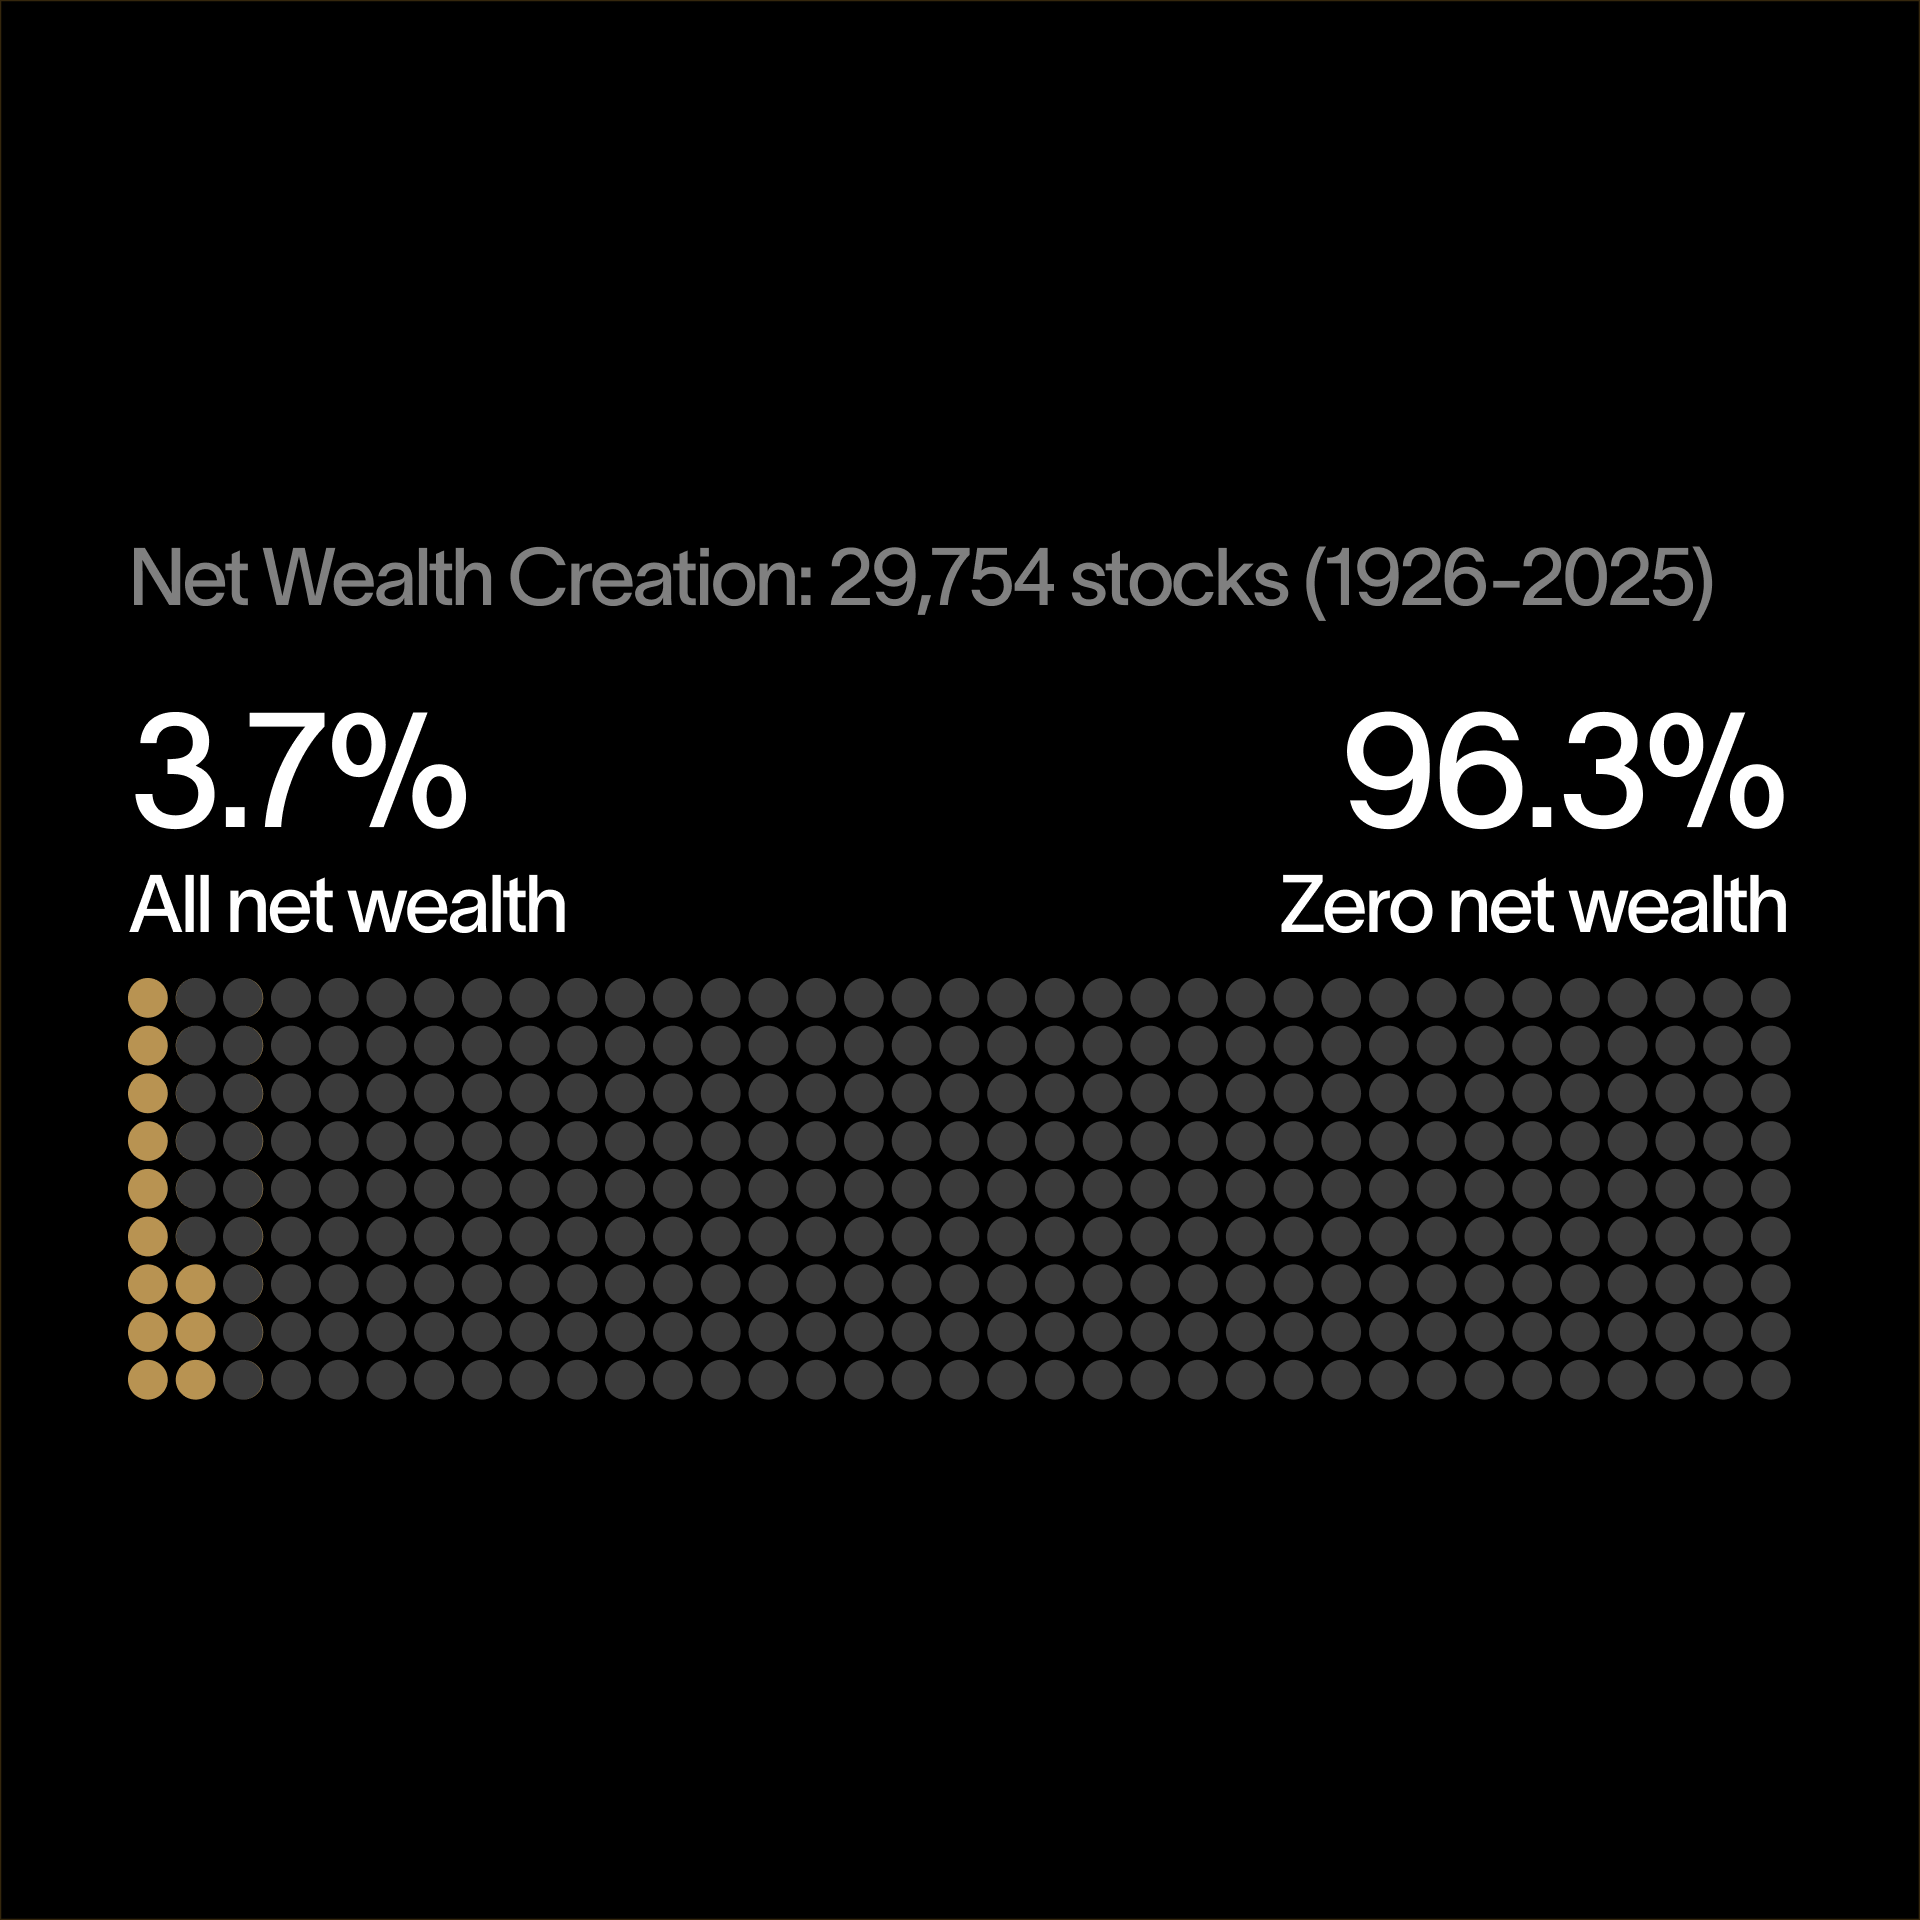
A small number of companies carry the market, and the eras above show that the names on that list keep changing. Of 29,754 US stocks from 1926 to 2025, just 46 account for half of the wealth the market created.⁷
We covered Professor Hendrik Bessembinder's study in Episode 1.
Why the strongest returns came before the top
Many of the companies in these studies were exceptional businesses, and the returns on the way up are part of how they got big in the first place.
By the time a company is among the largest in the market, much of its success may already be reflected in the price. Expectations are high because the record is good, and high expectations are harder to exceed. These figures are averages across almost a century, and averages hide a lot. Some companies stay at the top for decades. Most don't, and the record doesn't hint at which might retain their position during the next era.
What it means if you hold a concentrated position
In the conversations we have at Cache, the hard part is the quiet belief that a company is the exception to the historical trends. Sometimes it is. The railroad investor believed the same thing, and so did the GE investor.
They were right that a small number of companies create most of the market's wealth. The record just couldn't tell them which companies would come next. If one stock is most of your net worth, your financial plan may depend on that stock being one of the few that holds its position across eras.
Owning the broad market is one answer to that. It means holding the companies that lag as well as the ones that lead. That diversification still carries the risk of loss, and it may not suit every investor. What it removes is the need to guess. Across different eras, diversification is how an investor would have owned the railroads, and Standard Oil, and Coca-Cola, and Apple, and Nvidia.
You can believe in your company and still not want your financial plan to hinge on it being the exception, especially if one position becomes large enough to swing your entire portfolio.
Read the research
Each source is public if you'd like to read further.
- Dimensional Fund Advisors, "Magnificent 7 Outperformance May Not Continue" (December 2023) →
- Dimson, Marsh & Staunton, "UBS Global Investment Returns Yearbook 2025" (Public Summary Edition) →
- Innosight, "2021 Corporate Longevity Forecast" (May 2021) →
- Forbes, "Is Bigger Better? Stocks Tend To Underperform After Joining Top 10" (June 2021) →
- Hendrik Bessembinder, "One Hundred Years in the U.S. Stock Markets" on SSRN →
Diversifying a concentrated position without selling
If you already own one of today's largest companies, transitioning it into an index usually means selling and a capital gains tax bill. That tax bill may carve out a meaningful portion of your position, and the amount you give up doesn’t get the chance to be invested and compound.
An exchange fund is a third path: you contribute your shares alongside other concentrated holders and receive a diversified portfolio in return, benchmarked to a major index such as the S&P 500. Because it's a contribution rather than a sale, it's designed to defer the capital gains you'd otherwise realize rather than erase them. The trade-off is the commitment: exchange funds require a seven-year holding period under current tax rules, so it's a long-term decision.
The Cache Exchange Fund can help.



Make better decisions for managing your large stock positions.
Sign up to receive all our insights and data.