


How Cache Built the Modern Exchange Fund with 99% Correlation

Srikanth Narayan
Founder and CEO

Christopher Lange
Head of Investments
Last Updated: Oct 2025
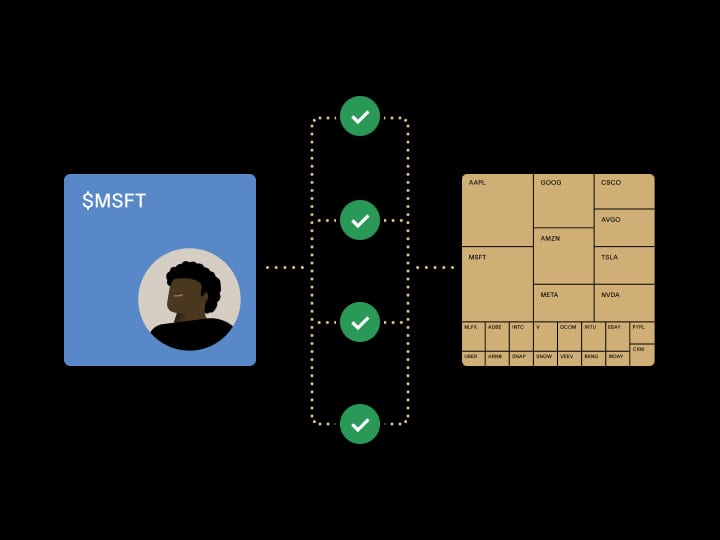
If you've worked in big tech, participated in a company's IPO journey, or invested early in a high-growth venture, your portfolio likely has one or two dominant stocks. We've witnessed this firsthand in thousands of conversations with investors: a VP with 60% in Microsoft, an early engineer with 80% in Palantir, an executive with 99% in Nvidia. The pattern repeats across the industry.
It’s a familiar dilemma: Sell to diversify, and you trigger a massive tax bill. Hold, and you’re exposed to the volatility and risk from a single stock.
Exchange funds have historically offered a way out to the ultra-wealthy, but the product suffered from structural inefficiencies: unpredictable capacity, limited access, tracking error concerns, and consistently high fees.
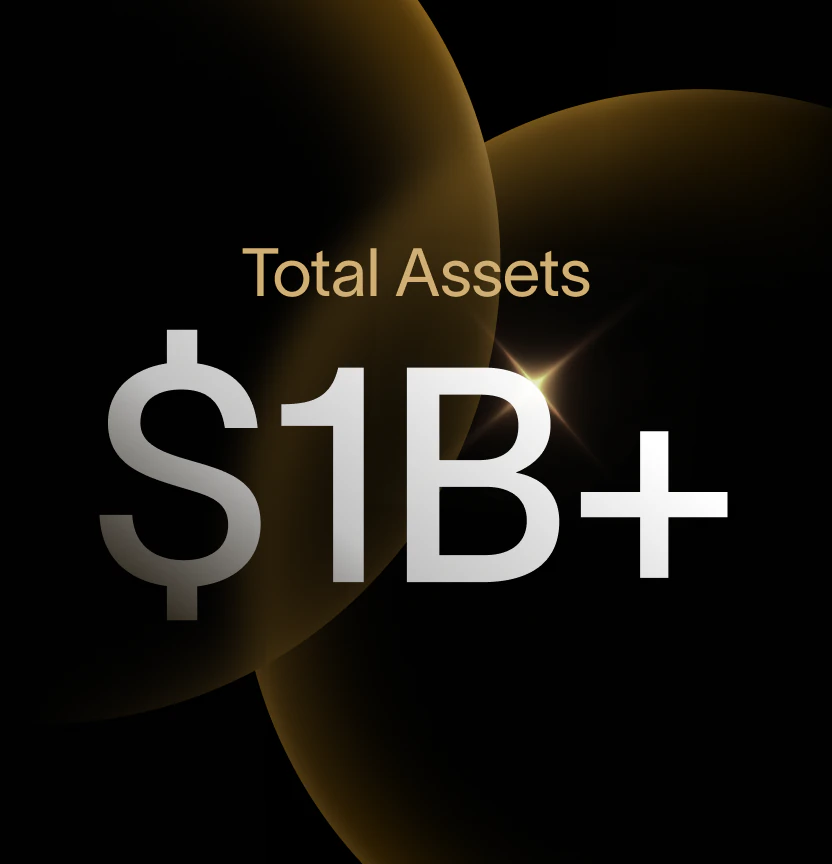
That’s the problem we set out to solve. In just over a year, Cache has broken through those structural barriers, earning the trust of investors and surpassing $750M in assets. This market response speaks volumes.
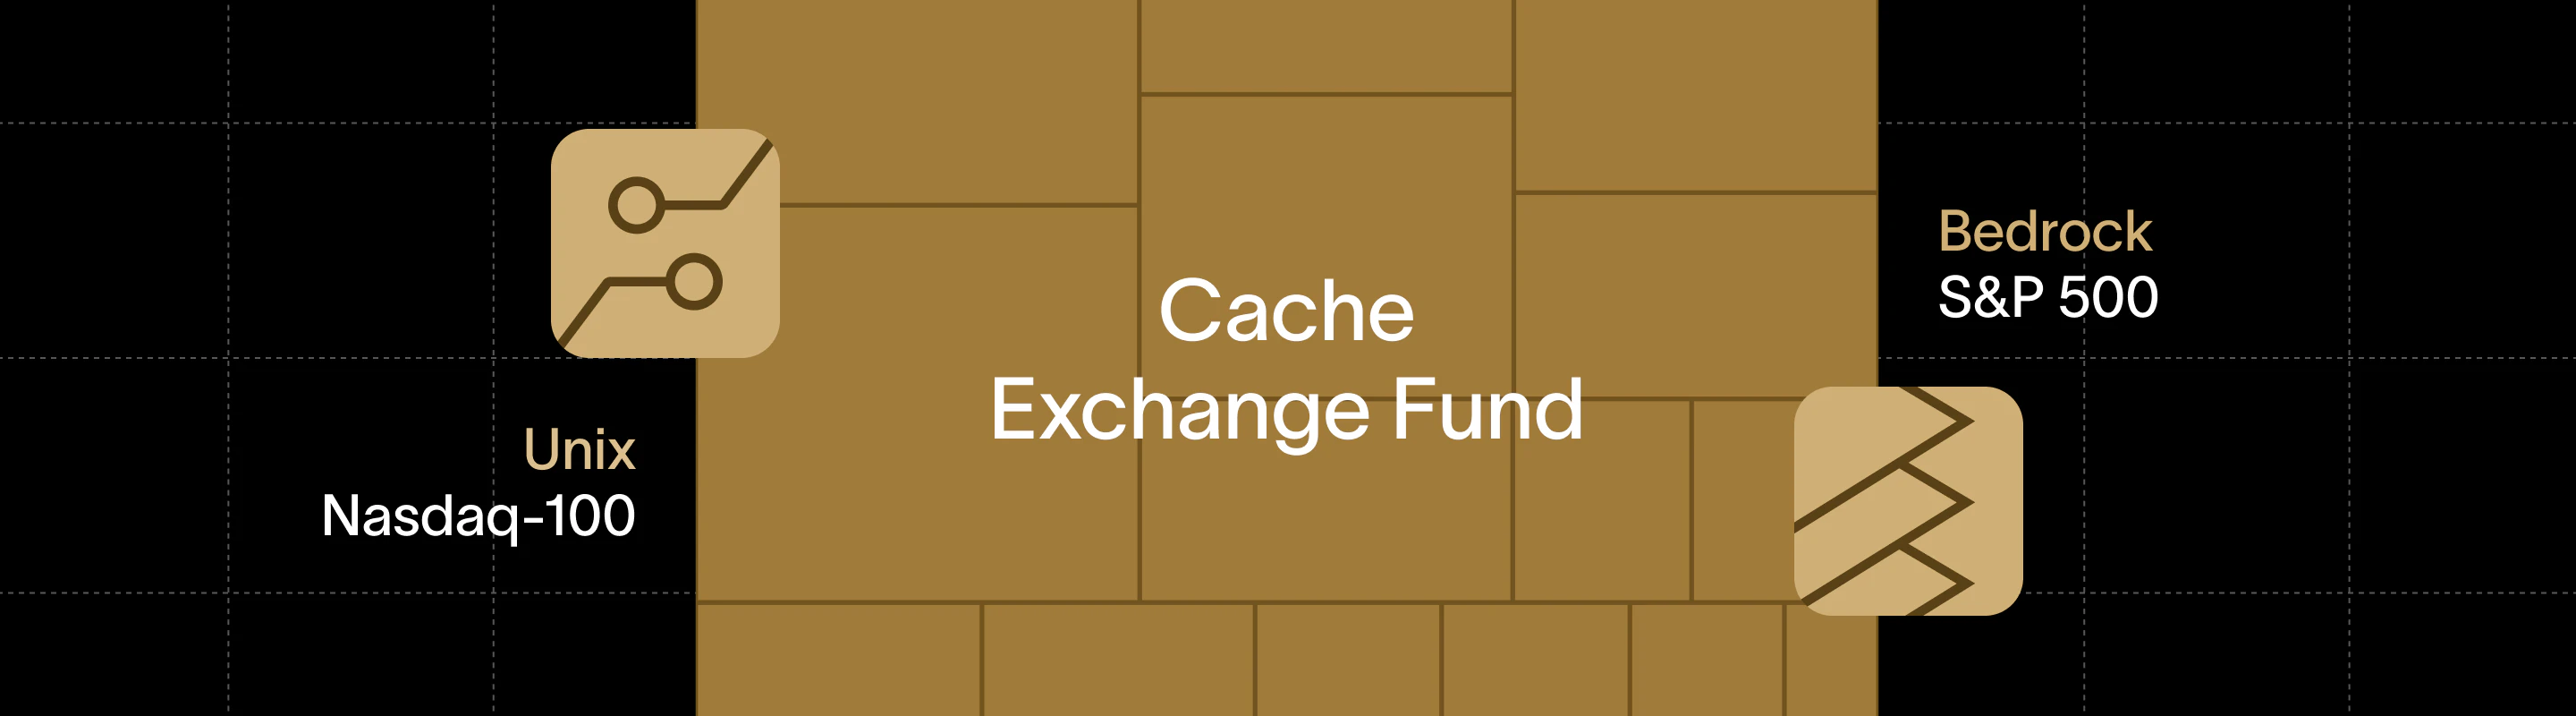
Reinventing the Exchange Fund, with S&P 500 and Nasdaq-100 Benchmarks
A few months ago, we announced our breakthrough Index Sync technology, a mechanism for aligning exchange fund portfolios to benchmarks with greater precision. We implemented it in two of our Flagship funds, Bedrock (S&P 500) and UNIX (Nasdaq-100), available to qualified purchasers. And, the early results are now in.
Results that speak for themselves
Our two funds implementing Index Sync now track their benchmarks with remarkable precision.
Bedrock closely models the S&P 500 benchmark (~1 beta to the benchmark).
UNIX, benchmarked to the Nasdaq-100 index, has achieved a 0.99 correlation to the index.
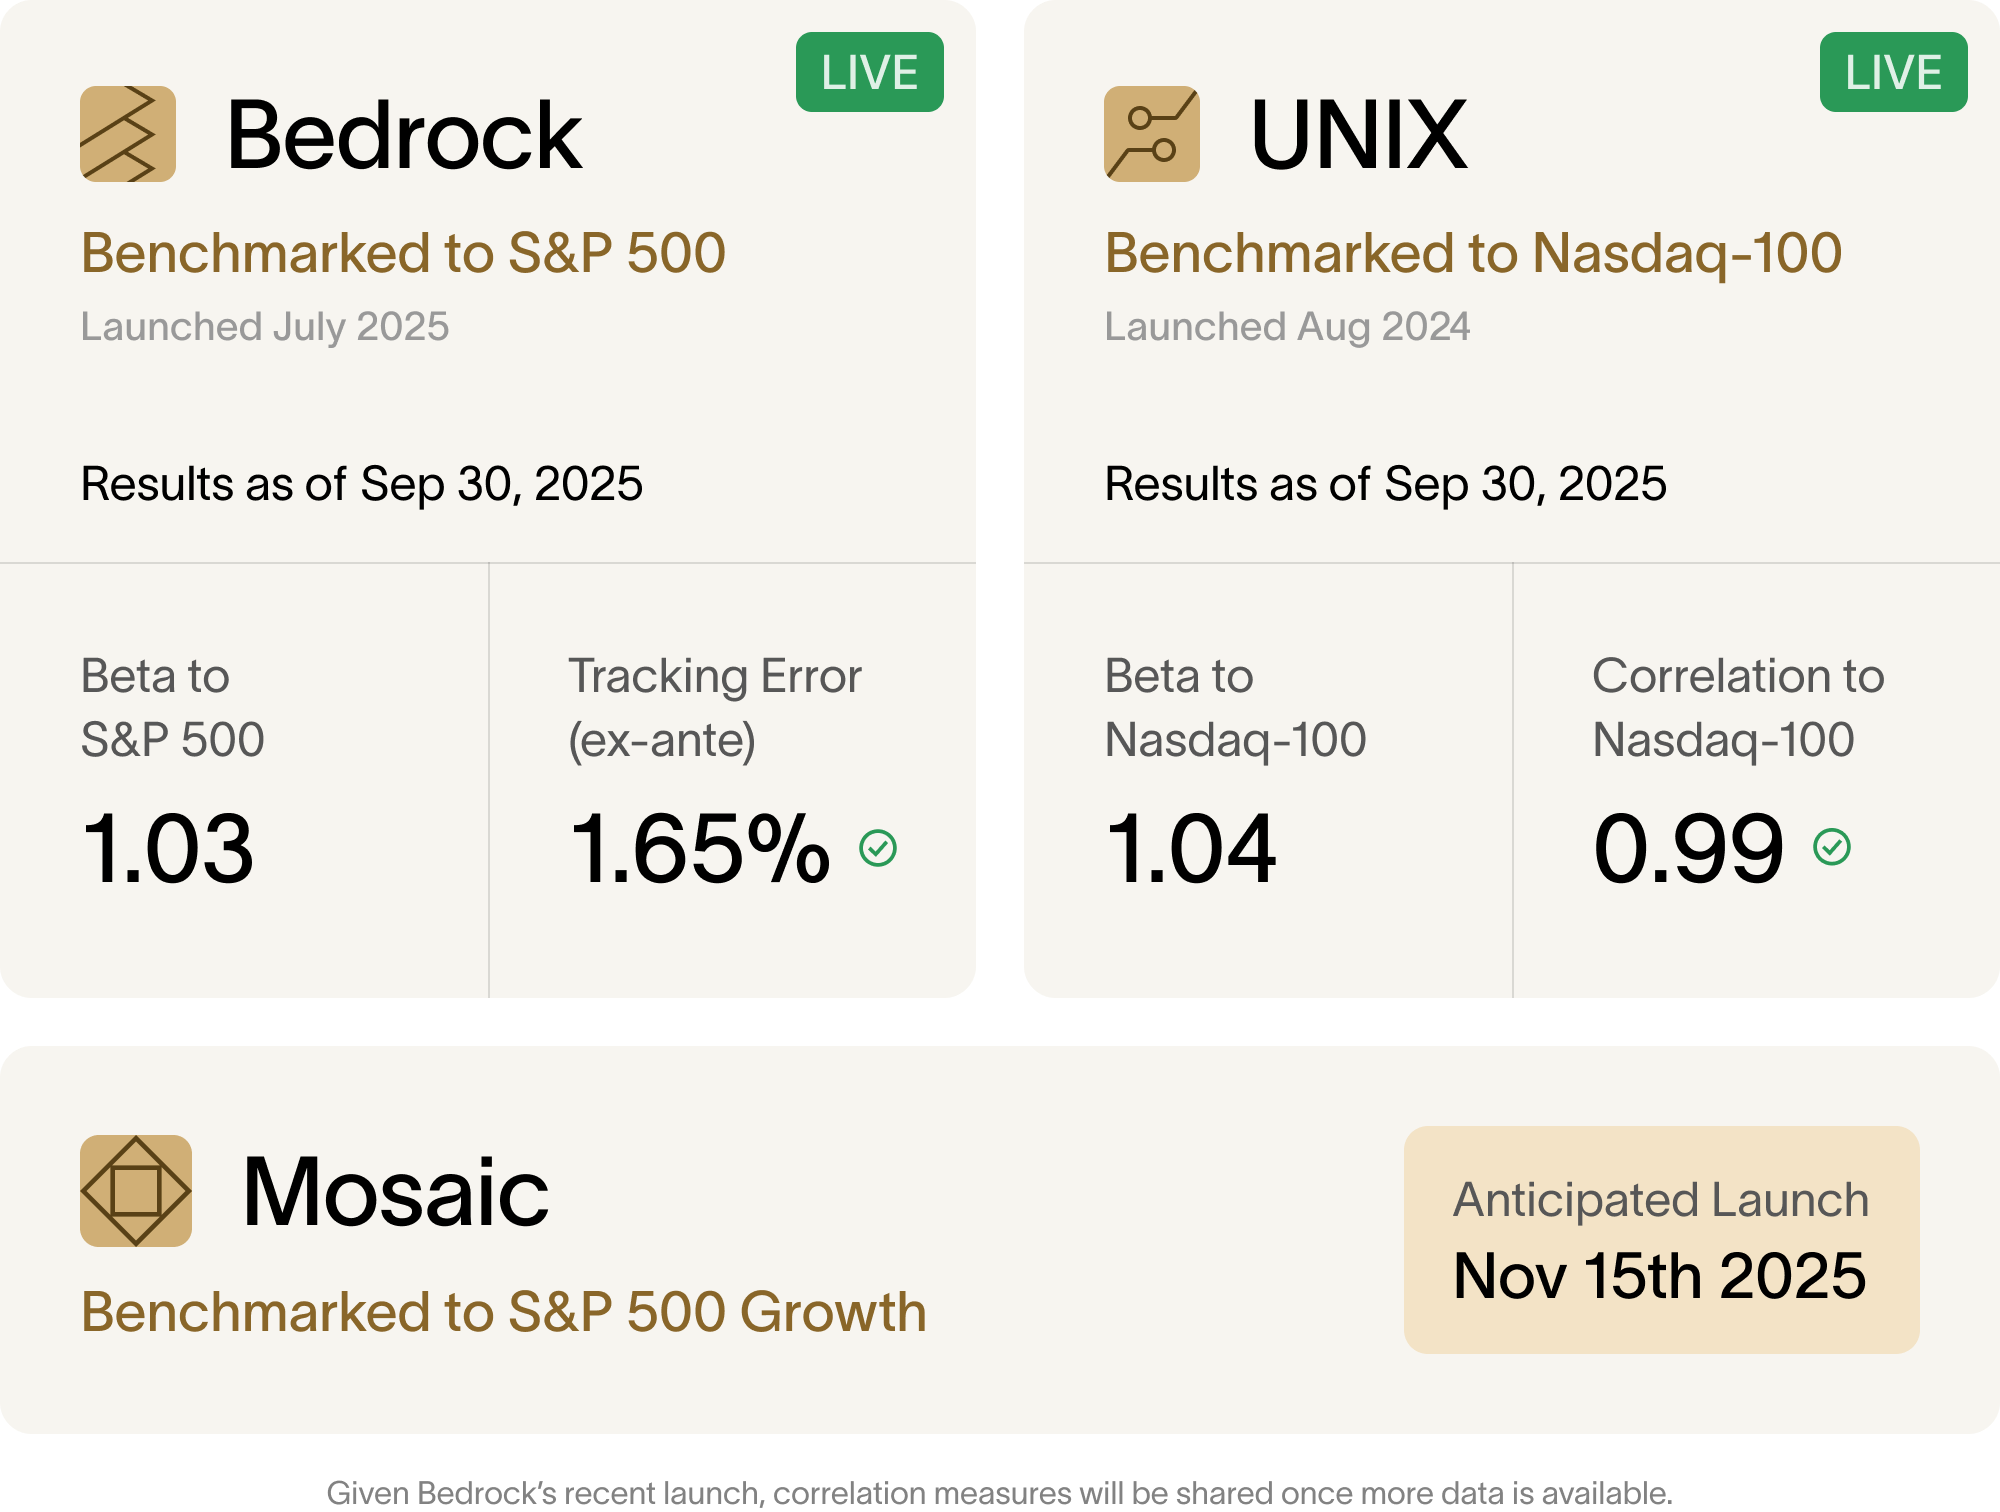
Exchange funds aim to approximate a benchmark by carefully balancing contributed stocks. Given the complexity of assembling the right stocks from diverse investors, we believe these results are exceptional.
Before we dive in, let's understand the two key risk metrics: correlation and beta.
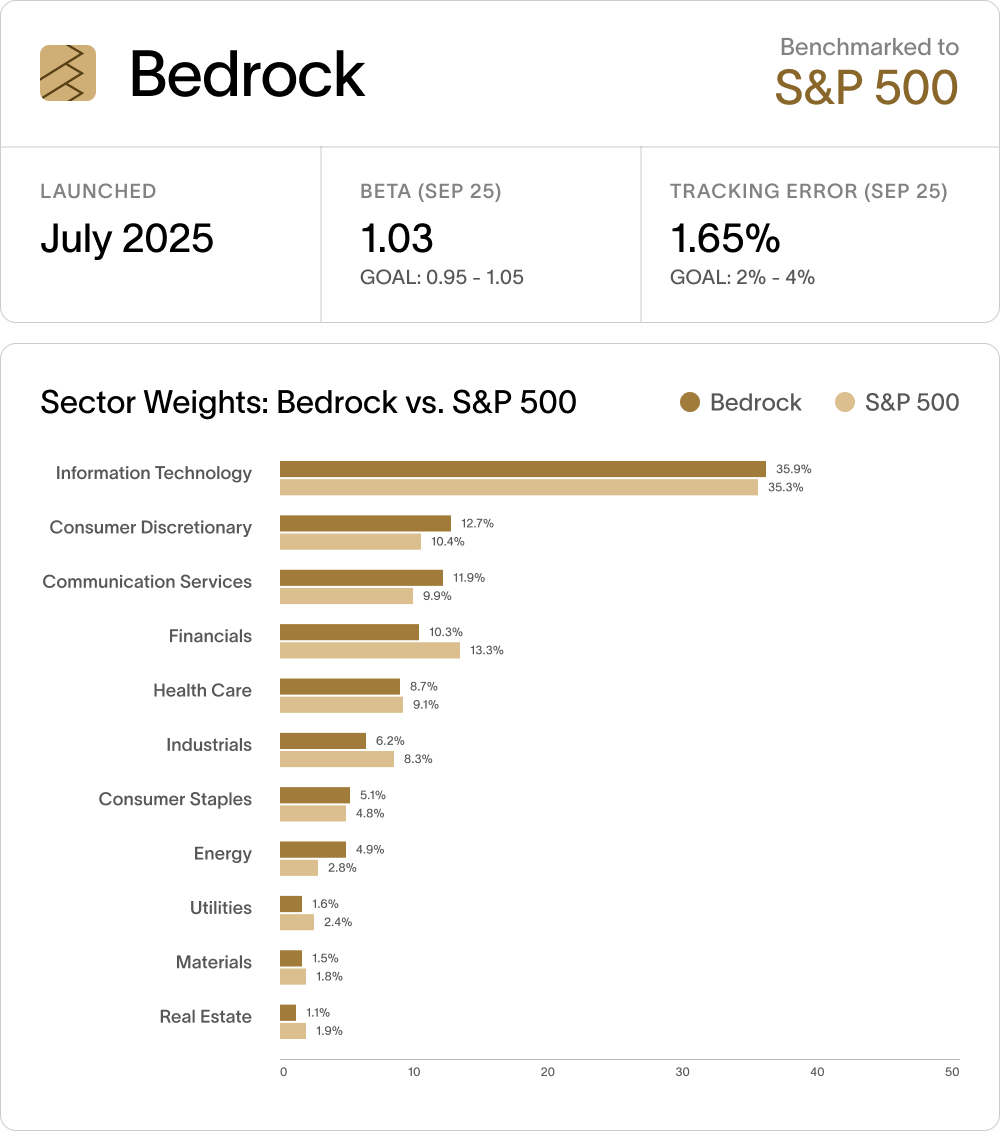
Cache Exchange Fund - Bedrock (S&P 500 Aligned)
Launched on July 16th 2025, Bedrock is designed for investors seeking to diversify their concentrated stock holdings for broad market exposure.
Although Bedrock launched recently, early results have been encouraging.
Portfolio exposure to over 450 underlying stocks across all sectors.
Beta: Forward-looking beta to the S&P 500 Benchmark of 1.03.
Close alignment across all 11 GICS sectors in the S&P 500.
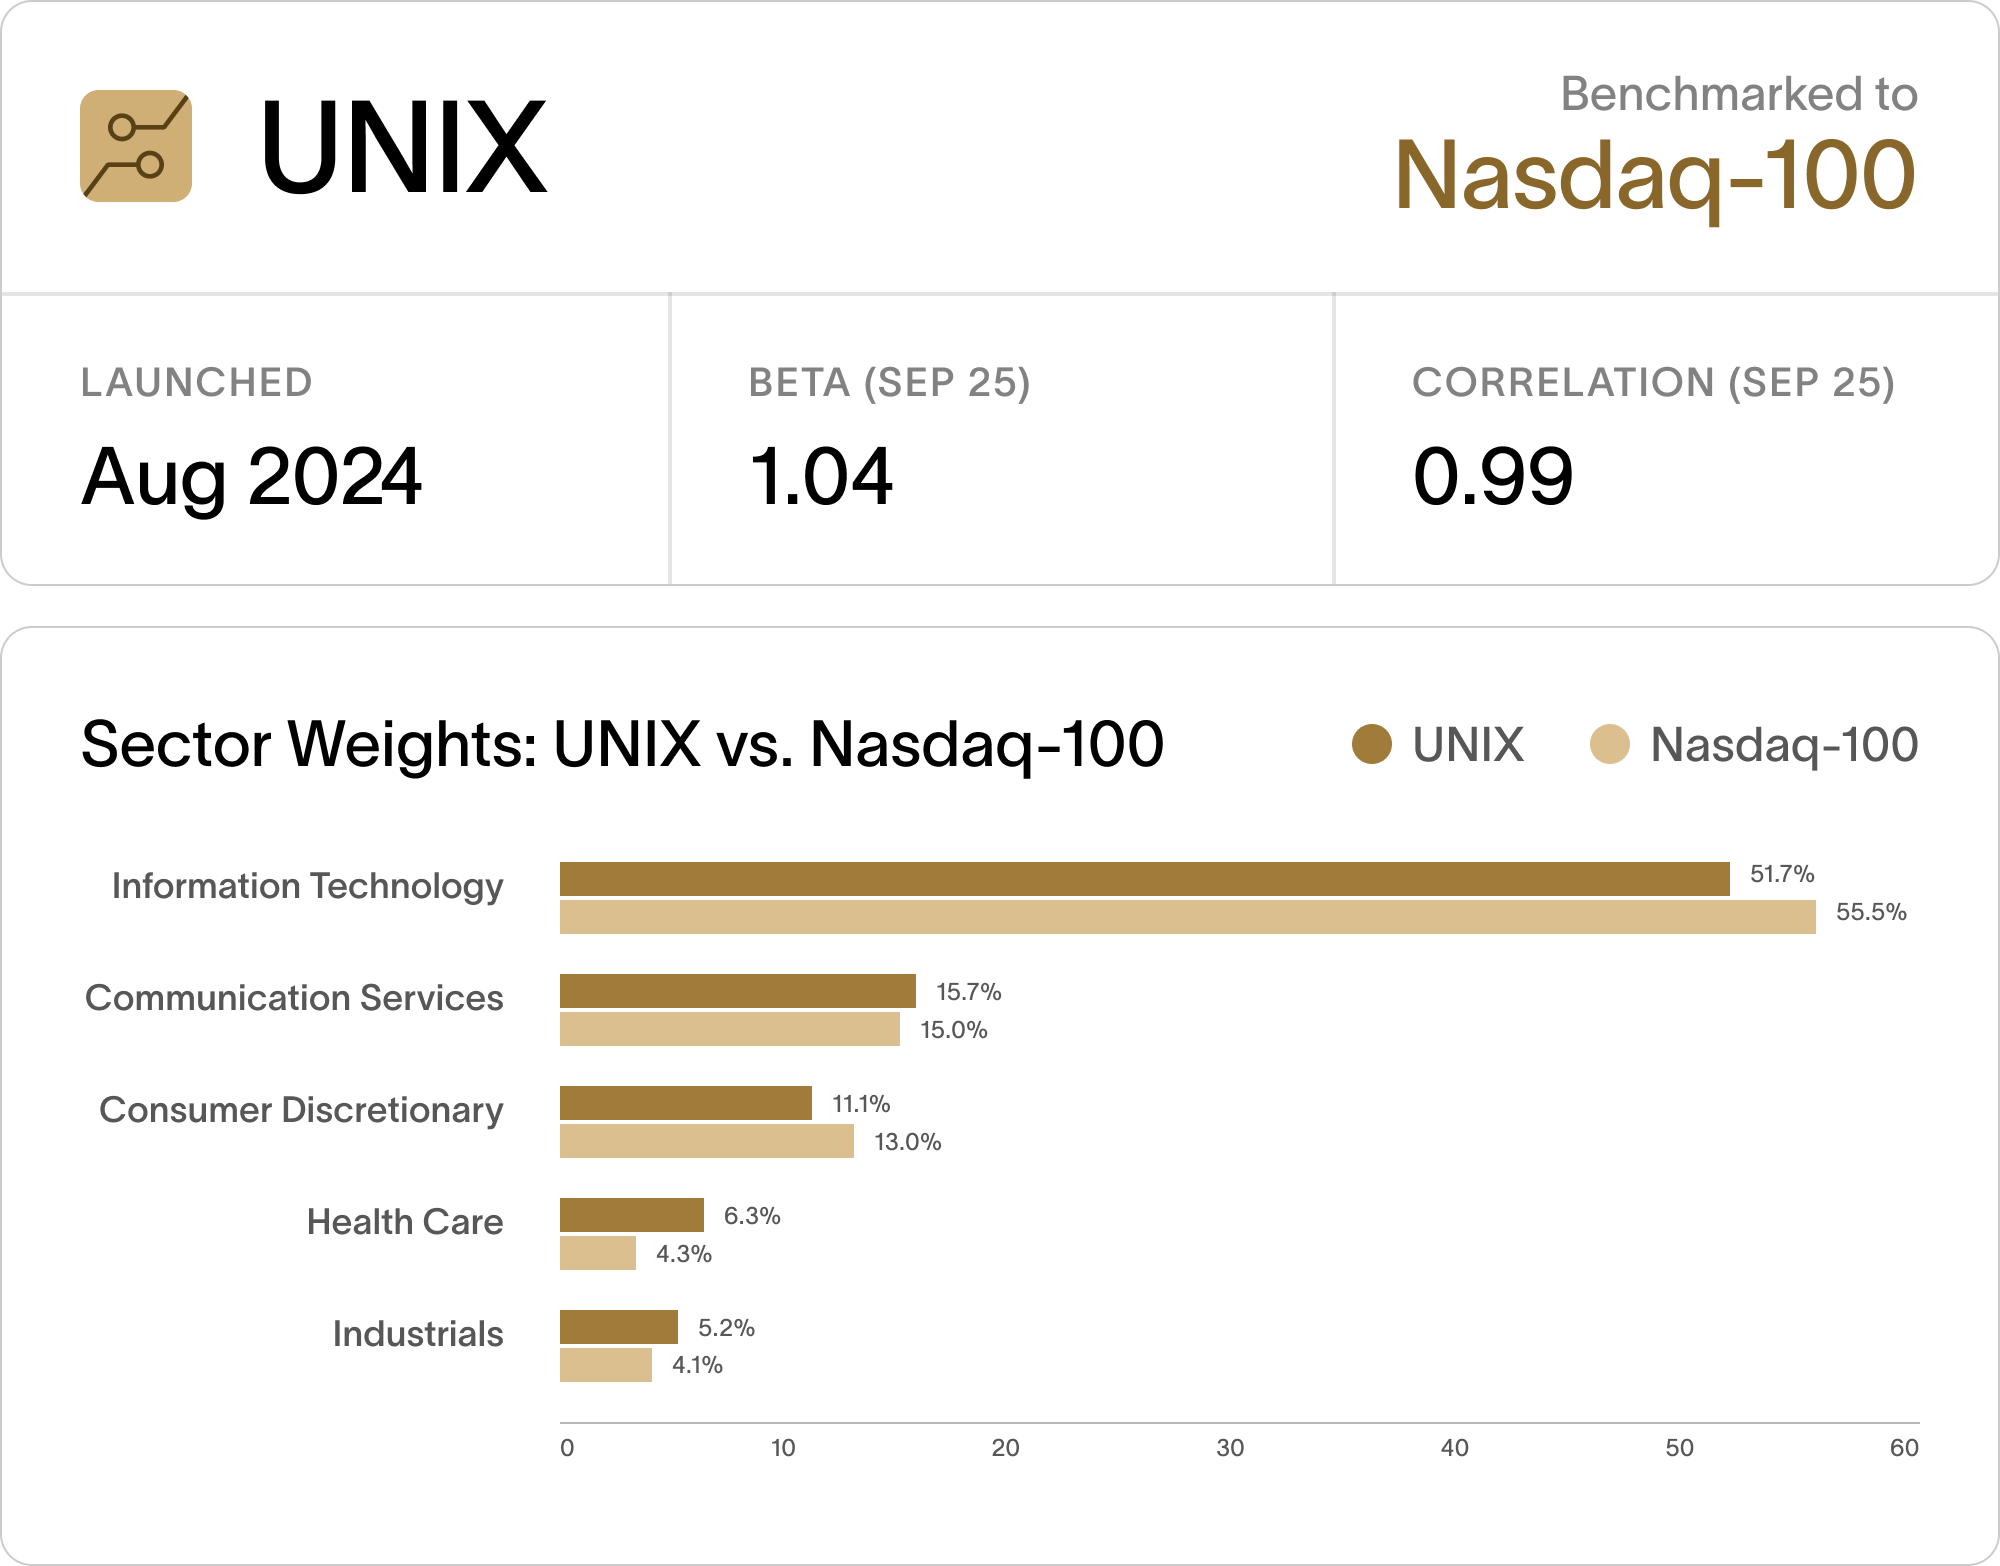
Cache Exchange Fund - UNIX (Nasdaq-100 Aligned)
Launched on August 30th, 2024, UNIX is designed for concentrated stockholders to diversify into a growth-oriented portfolio. We implemented Index Sync in July 2025 and saw rapid progress toward benchmark alignment.
Correlation: As of Aug 2025, the realized correlation to the Nasdaq-100 has improved to 0.99.
Beta: Forward-looking beta of 1.04, indicating tight alignment with the index.
Sector Alignment: Close alignment across key sectors: Information Technology at 49.1% vs 53.3%, Communication Services at 16.9% vs 15.8%, Consumer Discretionary at 11.7% vs 13.3%.
How We Engineered Index Precision
Traditional exchange funds aim to replicate broad-market exposure, but demand for tax-efficient diversification varies dramatically from stock to stock. While many stocks have multiplied in value over the last bull run, others have barely moved at all.
To replicate a broad-market index accurately, traditional funds must find appreciated stock in underperforming sectors—an incredibly difficult task. As the supply of these stocks is relatively thin, they’re often forced to turn away the very stocks investors actually want to diversify tax-efficiently.
This traditional approach has resulted in difficult choices between creating somewhat imbalanced sector exposure, which can result in portfolio drift over time, and narrowing eligibility that often excludes the stocks investors hold the most.
Cache rebuilt the exchange fund architecture from the ground up.
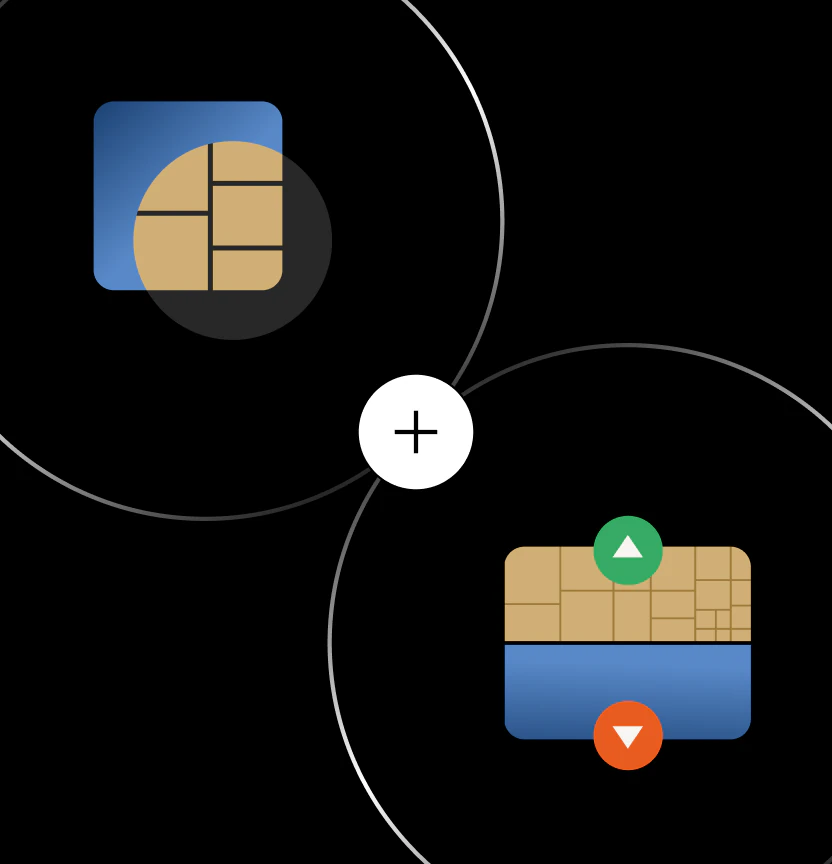
At the heart of the new model is Index Sync, our method of dynamically aligning each fund to its benchmark, whether the S&P 500 or Nasdaq-100, using an ETF as an integral part of the portfolio. Because ETFs can track their benchmarks with precision, we are able to fill sector gaps and manage portfolio drift tax-efficiently.
We also rethought what happens at intake. Each contributed stock is assessed on its headline value, but also on how it fits the benchmark: sector alignment, style exposure, and risk contribution. That lets us accept more of the stocks people actually hold, while keeping the portfolio on track.
The result is a structure designed for greater predictability and alignment.

Setting a New Standard
For most of their 70-year history, exchange funds served a narrow set of ultra-high-net-worth investors. Operational opacity was the norm, and upon exit, investors received a varied selection of stocks based on the manager’s discretion.
Cache has now set a new standard.
- Our portfolios are designed to closely track the S&P 500 and Nasdaq-100.
- After seven years, investors receive a representative basket that contains ETF shares and stocks.
- High-growth names can be contributed without sacrificing index alignment.
- Minimums start at one-tenth of the traditional thresholds.
- Our funds close biweekly.
- All with vastly lower fees.
This is not just a better exchange fund. It’s a new model for how concentrated stockholders can diversify tax-efficiently.
Holding a concentrated stock position, and looking to diversify tax-efficiently?
👉 See if you qualify for the upcoming fund close.
--
The Cache Exchange Fund can help.


Make better decisions for managing your large stock positions.
Sign up to receive all our insights and data.